Engineering / Earth observation
Italian
Flood Atlas.
Mapping the May 2023 flood in Emilia-Romagna with satellite radar.
I trained a flood segmentation model on the Kuro Siwo benchmark and applied it to Castel Bolognese. Compare its predictions with the radar images and Copernicus emergency maps, then see how the model was evaluated.
Explore the map01 / The map
Castel Bolognese, May 2023
The Senio valley after the flood of 16–17 May. Radar acquired 22 May 2023 05:19 UTC.
Choose a layer for each side, then drag the divider to compare. You can also focus the divider and use the arrow keys.
Historical case study. The Italian maps are a qualitative comparison; accuracy is measured on the benchmark below. Not for emergency use.
Loading the map

22 May 2023 radar
U-Net v1
Legend
Radar backscatter, VV
-22 dB0 dB
Dark: smooth surfaces such as open water. Bright: buildings and rough ground.
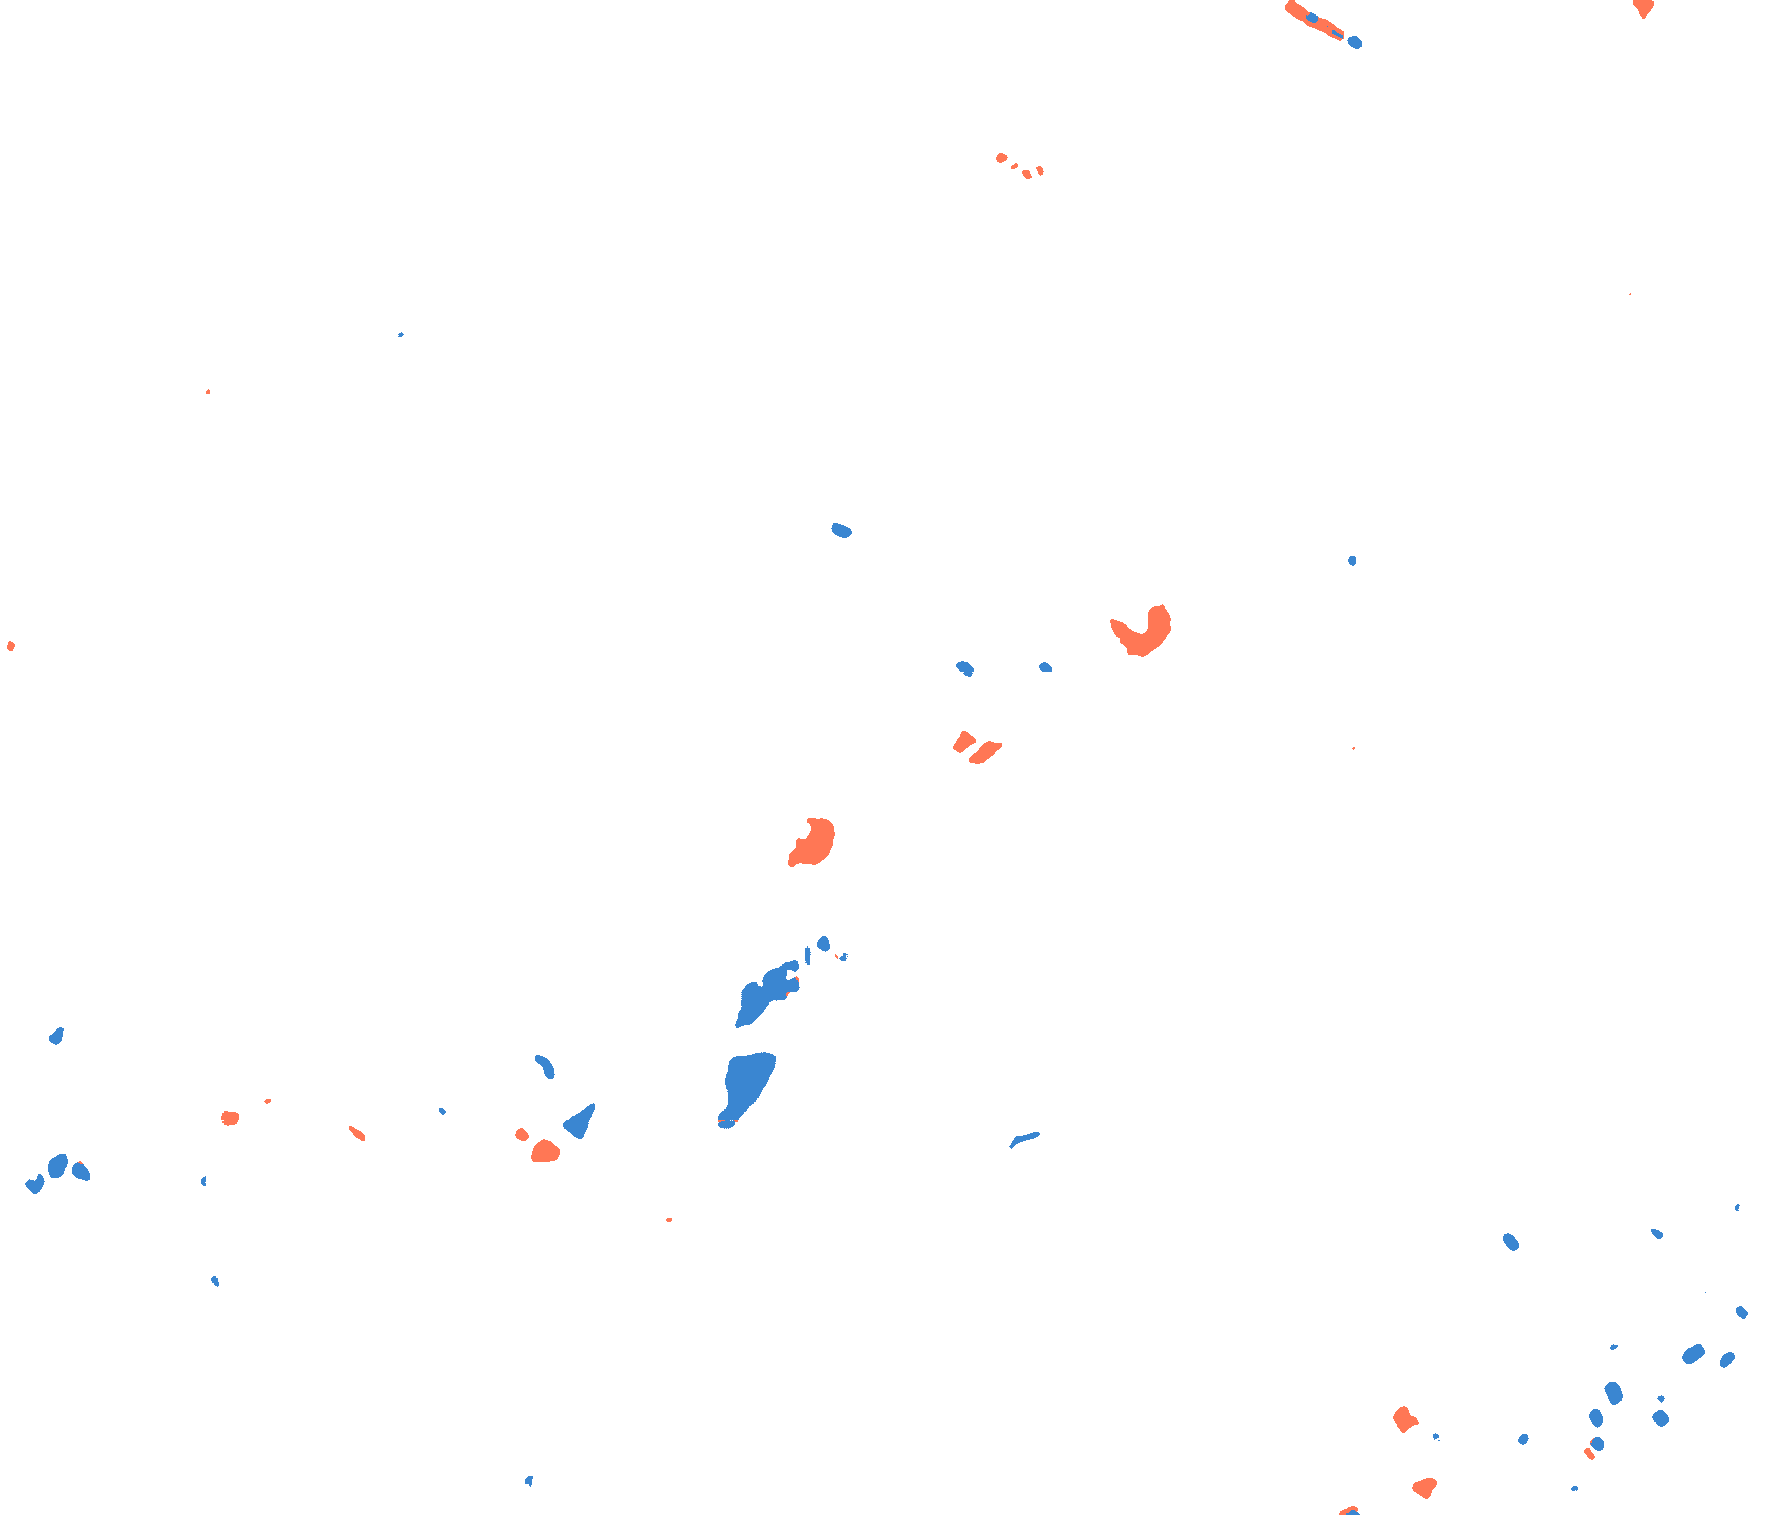
Predicted classes
- Permanent water
- Flood
- No data None in this event
- No water Unfilled areas within the radar grid
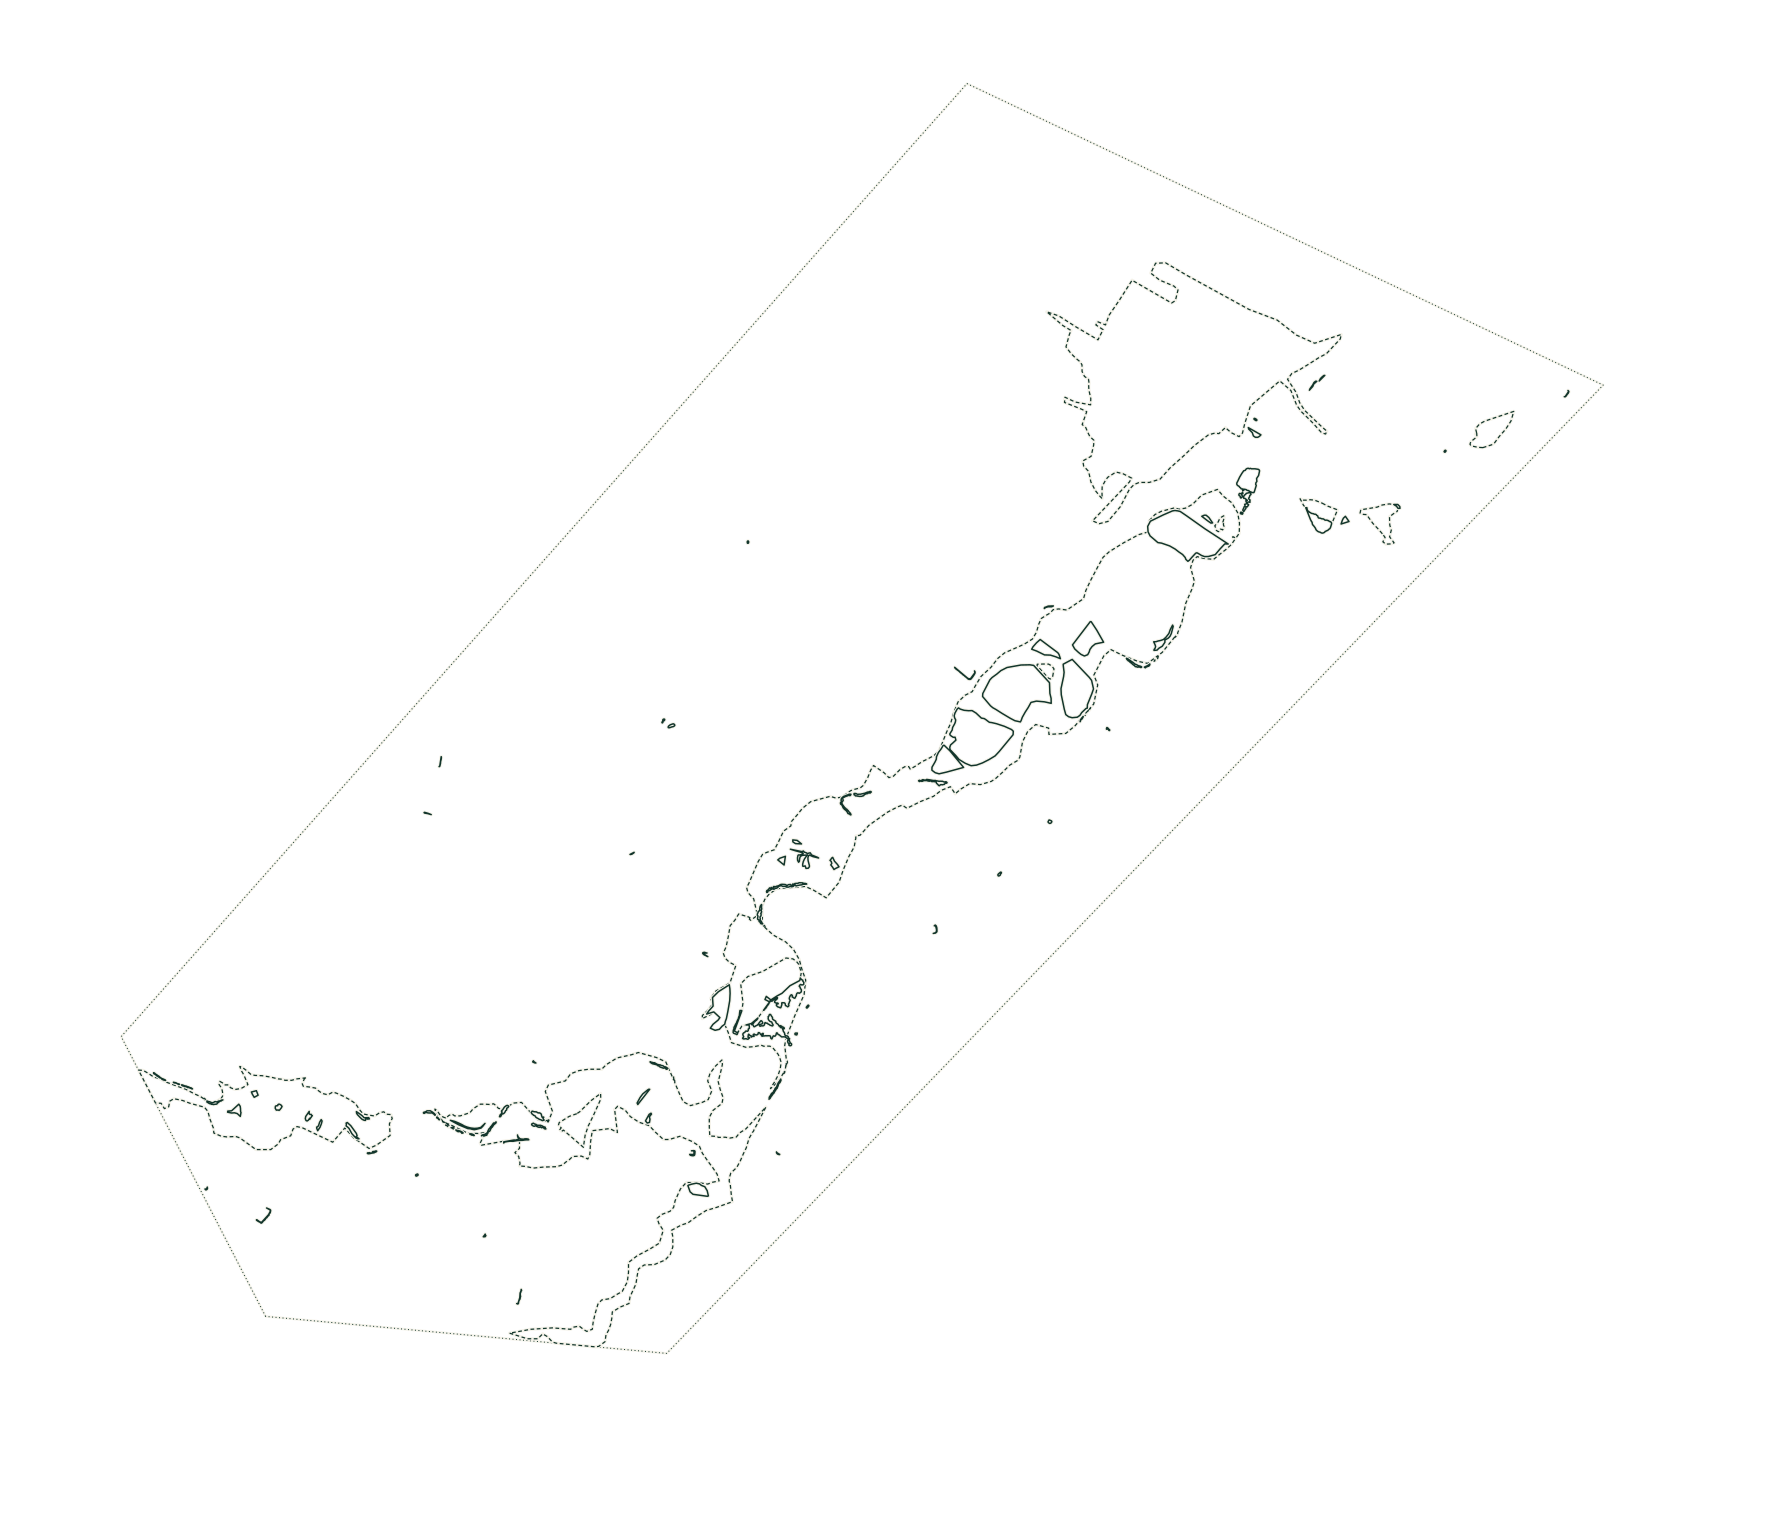
Reference, outlines only
- Flooded area
- Flood trace Deposits or damage, not standing water
- Area mapped by CEMS Outside it, nothing was mapped
Not shown
Layers cover only the model grid around Castel Bolognese; elsewhere the map shows the basemap alone. Flood probability is not published: the model’s scores are not calibrated, so only classes are shown.
02 / Findings
What the radar picked up
By 22 May, five days after the flood peak, both methods mark little of the flooded area shown by Copernicus.
The model’s flood patches follow the Senio, mainly within the mapped flood traces. The baseline produces more scattered water predictions in the surrounding fields.
This comparison has a timing gap: the Copernicus map uses Pleiades-1A-1B imagery from 22 May 2023 10:26 UTC, about 5 hours after the radar. Its flood traces include deposits and damage left by receding water.
Radar can miss shallow water, water beneath vegetation and urban flooding. The available emergency map has no independent wet/dry labels for evaluating this model, so the overlap is descriptive.
Pixel counts and overlap with Copernicus
Share of the 2.68 M pixels in each predicted class.
| Prediction | No water | Permanent water | Flood |
|---|---|---|---|
| U-Net v1 | 99.38% | 0.36% | 0.26% |
| Fixed VV change baseline | 96.91% | 2.47% | 0.62% |
Overlap with the CEMS delineation, inside the 0.90 M pixels CEMS mapped, where its flooded area covers 1.5%.
| Share | U-Net v1 | Fixed VV change baseline |
|---|---|---|
| Of the CEMS flooded area, predicted flood | 6.8% | 8.9% |
| Of the CEMS flood trace, predicted flood | 3.9% | 4.1% |
| Of the predicted flood, inside the CEMS flooded area | 18.0% | 12.4% |
| Of the mapped area, predicted flood | 0.56% | 1.07% |
Descriptive overlap only, not accuracy: a later optical observation, an unlabeled background and flood traces that are not standing water.
03 / The data
Three radar acquisitions
Sentinel-1A, VV and VH.
The model compares VV and VH radar bands from three dates, processed using the benchmark’s workflow. The map shows VV on a fixed stretch from −22 dB to 0 dB, the same for every date.
| Acquired | Role | Note |
|---|---|---|
| Pre-event | Before both May floods. | |
| Pre-event, recent | After a separate flood on 2–4 May (CEMS EMSR659), so not established as dry. | |
| Post-event | The image the model labels. |
Processing, reference mapping and limitations
- Model grid
kuro-siwo-unet-v1on 1,766 × 1,515 pixels, processed in 224 × 224 chips.- Baseline
kuro-siwo-vv-change-v1. Flood where post-event VV is at most −13.5 dB and drops by at least 1.75 dB from the pre-event mean.- Reference
- Copernicus Emergency Management Service EMSR664, AOI03,
EMSR664_AOI03_GRA_PRODUCT_v1. Pleiades-1A-1B imagery at 0.5 m. Solid outlines show flooded area; dashed outlines show flood traces. The dotted line bounds the mapped area; its background is unlabeled.
- The 10 May acquisition follows an earlier flood on 2–4 May. Remaining water can be classified as permanent water.
- The April acquisition is darker than the May images. Changes in soil moisture or crops can also change the radar signal.
- This is one area, outside the model’s training data. The elevation model, radar levels and season differ from the benchmark.
- Copernicus outlines provide context rather than ground truth. ISPRA hazard zones are not used.
04 / Model evaluation
Tested on Kuro Siwo
Public Sentinel-1 flood benchmark
The U-Net improves flood IoU from 0.542 to 0.636 against a simple radar change rule.
IoU measures the overlap between predicted and labeled flood pixels: 1 is a perfect match. These scores apply to the benchmark, which contains no Italian events.
- U-Net v1 · Flood IoU
- 0.636
- Radar baseline · Flood IoU
- 0.542
15,896 chips from 10 held-out events, model and baseline on the same 787.3 M pixels. No test chip overlaps a training or validation chip.
| Class | Model P / R / IoU | Baseline P / R / IoU |
|---|---|---|
| Flood | 0.821 / 0.739 / 0.636 | 0.651 / 0.764 / 0.542 |
| Permanent water | 0.617 | 0.321 |
| Any water | 0.841 / 0.815 / 0.706 | 0.663 / 0.852 / 0.594 |
P precision, R recall, IoU intersection over union. Permanent water: IoU only.
- The model produces fewer false flood predictions: 6.2 M false-flood pixels against 15.7 M for the baseline, at slightly lower recall.
- The labels are expert interpretations of the same radar images, so scores measure agreement with that interpretation, not with independent ground truth.
- Flood probability scores are poorly calibrated in the middle range. The map shows classes only.
Model, training and selection
- Task
- Per-pixel segmentation of Sentinel-1 radar into no water, permanent water and flood.
- Input
- Six bands, VV and VH in decibels: one post-event and two pre-event images, terrain-corrected at 10 m.
- Model
- U-Net with 1,929,347 parameters, exported to ONNX (opset 18, 7.8 MB).
- Training
- 21,462 water-containing chips of 224 × 224 pixels from the Kuro Siwo benchmark’s official training events; 3 seeds of 30 epochs.
- Selection
- Seed 1, epoch 6, chosen by flood IoU on validation events at locations not used in training (0.658; seeds 0.634–0.658).
- Baseline
- A fixed two-date rule fitted on training pixels only: flood where post-event VV ≤ −13.5 dB and it dropped by at least 1.75 dB from the pre-event mean.
ONNX verification and CPU performance
- Agreement
- On 135.9 M validation pixels, ONNX Runtime differs from PyTorch float32 on 1 pixel and from the evaluated predictions on 0.010%; flood IoU changes by 0.00046.
- Speed
- 1.3–1.5 megapixels per second on 4 cores of a local Intel Core Ultra 7 265H; one 224 × 224 chip takes 0.038 s.
- Memory
- About 1.4 GiB per input megapixel with the default memory arena, 0.66 GiB without it.
- On this site
- Maps are computed offline and published as static images; model inference runs offline.
Sources & credits
Sentinel-1 radar · Copernicus EMSR664 · Kuro Siwo benchmark · OpenStreetMap
Data attribution and software licences
- Contains modified Copernicus Sentinel data (2023), processed with ESA SNAP.
- © European Union, Copernicus Emergency Management Service (2023), EMSR664 AOI03 GRA_PRODUCT v1. Underlying optical imagery is not republished.
- Terrain correction produced using Copernicus WorldDEM-30 © DLR e.V. 2010-2014 and © Airbus Defence and Space GmbH 2014-2018 provided under COPERNICUS by the European Union and ESA; all rights reserved.
- Kuro Siwo (Orion AI Lab), labeled GRD set, CC BY 4.0: dataset paper.
- Basemap: © OpenStreetMap contributors, and Natural Earth, through Protomaps. Noto Sans under the SIL Open Font License.
- MapLibre GL JS and other client software: third-party licences.